Masterthesis
Dimensionality reduction using Autoencoders

- pandas
- Jupyter
- keras
- dimdrop
- numpy
- seaborn
- matplotlib
My master thesis which completed my degree in Computer Science. It concerned research into dimensionality reduction and visualization techniques for high-dimensional data using autoencoders. The full text can be found in the online library of Ghent University. It is written in Dutch, but it contains an extended abstract in English.
Dimdrop
For my thesis I implemented a lot of models in Python using the keras framework to be used for my experiments.
Afterwards I released them as an open source pip package called dimdrop.
Summary
Advances in flow cytometry allow to measure increasing amounts of parameters per cell, generating high-dimensional datasets. Visualizing these datasets in their raw form is tedious and confusing. Dimensionality reduction can be used to reduce the amount of dimensions in the datasets. When reducing to two dimensions we can visualize the dataset in one scatter plot.
Dimensionality reduction
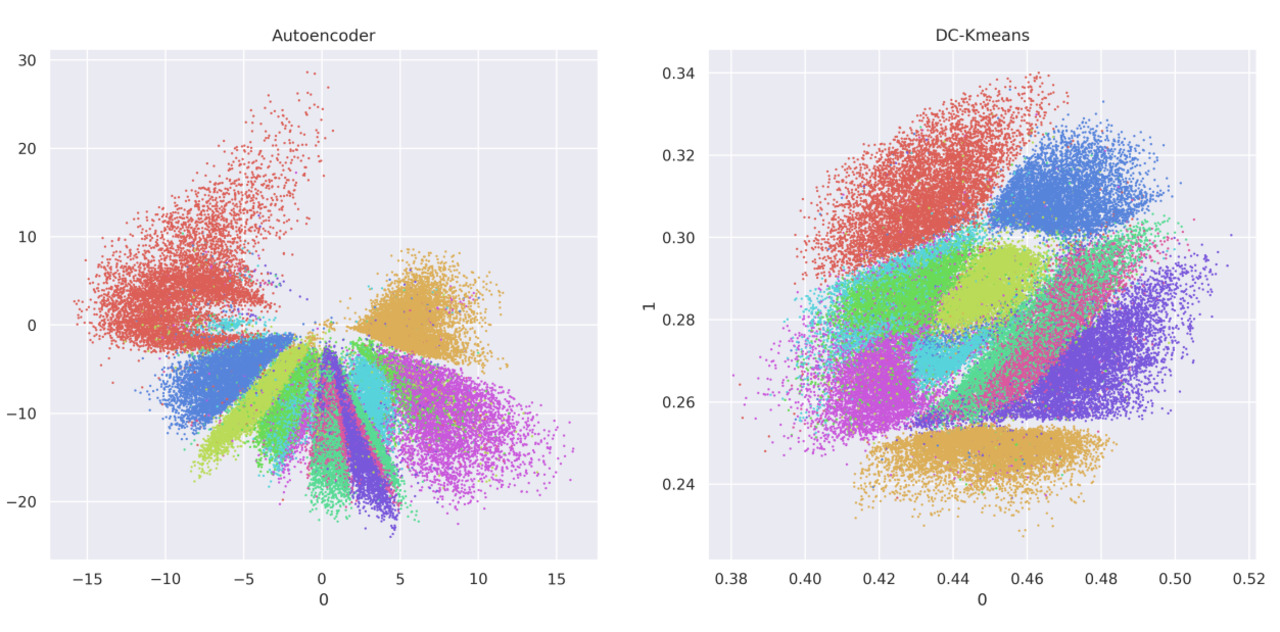
I researched a lot of different dimensionality reduction methods, some of which were based on Autoencoders. Due to the design of an autoencoder with a middle layer with lower dimension than the outer layers it is possible to use this layer to perform dimensionality reduction. These methods can be divided into two classes.
Parametric
Performing the reduction generates a model which can then be used to reduce additional data with a lower computational cost. Autoencoders are part of this category as they can be trained on the initial data and then the trained model can be used for other data. Other examples are PCA and Parametric t-SNE (uses a neural network with special loss function).
Non Parametric
Performing the reduction just yields the reduction, the reductions are often better at preserving the local structure of the data. Examples are t-SNE and UMAP.
Evaluation
Additionally I researched about metrics to objectively score the reductions produced by these methods. These can also be dividen into two categories.
Neighborhood based
Scoring how well the neighborhoods are preserved in the data. Done by looking at the nearest (or furthest) neighbors of a data element and scoring how well these are kept in the reduction.
Clustering based
Scoring how well clustering can identify different classes in the data. Done by looking at a clustering result of the reduction and comparing it with the known classes of the data.
Comparison
Then I made an extensive comparison of the models using different datasets and by scoring them on the metrics I researched.
