COVID-19 Observables
Visualizing Belgian COVID data using D3
Finished
- D3
- topojson
April 2020
-
October 2025
Links
Tags
About
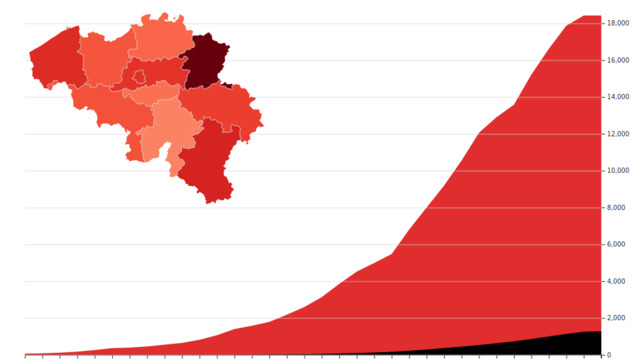
While the work for my volunteership in Sweden was drying up due to the COVID-19 pandemic, I took advantage of the extra time by learning D3. Almost simultaneously Sciensano published the data of the outbreak in Belgium as open data. So I made some interactive visualizations of the data on Observable.
They can be viewed here.